NPV Profile is the graphical representation of NPV at various discount rates. This is used to study the trend in variation of NPV with respect to the Discount Rate.
- NPV Profile is also used to study the crossover rate of various projects. Crossover Rate is the discount rate at which the net present values of two projects are equal. It is the point at which the NPV profile of one project intersects the NPV profile of the other project.
The various discount rates considered are 0%,5%,6%,7%,8%,9% and the project generates cash flow as below:
| Year | 1 | 2 | 3 | 4 | 5 |
|---|---|---|---|---|---|
| Net Cash Flow (Rs.) | 110 | 130 | 120 | 120 | 135 |
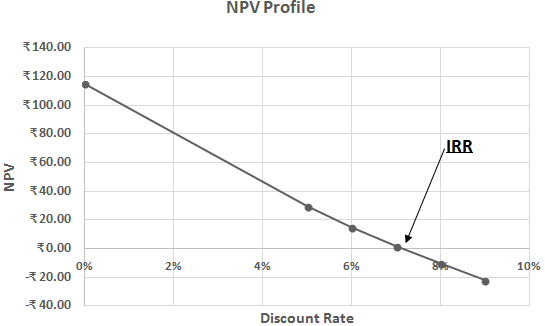
- The point at which the line intersects the X-axis is the IRR for this cash flow.
- The point at which the line intersects the Y-axis is the NPV when the discount rate is 0%.
| Initial Investment | Year 1 | Year 2 | Year 3 | Year 4 | Year 5 | |
| Net Cash Flow Investment 1 | 500 | 110 | 130 | 120 | 120 | 135 |
| Net Cash Flow Investment 2 | 2000 | 500 | 600 | 650 | 400 | 200 |

- The point at which both lines intersect each other is the Crossover Rate.
