Multipliers
The output of an Economy (GDP) is dependent on Aggregate Demand. The formula used to calculate the Aggregate Demand and GDP of a country is the same as given below.GDP or AD = C + I + G + XWhere,
AD = Aggregate Demand
C = Consumer Spending on Goods and Services
I = Investment Spending
G = Government Spending on Public Goods
X = Net Exports (Export-Import)
- From the above equation, it is clear that any increase in C, I, G, X will lead to an increase in GDP or Aggregate Demand and vice-versa. At first, it seems that the effect in the change of any of the components on the Right Side (C, X, I, G) will have a proportional effect, but the effect is manifolds.
- Multiplier refers to the scenario where the change in any component of Aggregate Demand will lead to a Multiple Change in the Aggregate Demand or GDP. Let us understand it with the help of an Illustration.
Illustration 1:
The Indian Government planned to Invest an extra sum of Rs. 10 in MNREGA schemes this year. Now let us see the stepwise flow of this Rs. 10
Let use see a table that summarises the above flow.
To summarise the points above, we can say that an Increase in Investment by Rs. 10 has created Rs.24.4 (10 + 8 + 6.4) in the system i.e. added to the GDP, this is known as Multiplier Effect.
The multiplier can be calculated using the following formula,
$$Multiplier(k)=\frac { Change\quad in\quad GDP }{ Increase\quad in\quad Components } $$
For the above Illustration, Multiplier can be calculated as
- Rs. 10 is paid as wages, bills, cost of raw materials, and it ultimately reaches the population as Income. Suppose the population has a habit of Saving 20% and spending 80%
- Out of the total Rs. 10 received by Public, they will spend Rs. 8 on various commodities and goods and will save Rs. 2
- The Rs. 8 goes to other parts of the population as income (sellers, producers, etc), they spend Rs. 6.40 (80%) and save the remaining Rs. 1.60 (20%)
- Rs. 6.4 again goes to another segment as income and it continues.
To summarise the points above, we can say that an Increase in Investment by Rs. 10 has created Rs.24.4 (10 + 8 + 6.4) in the system i.e. added to the GDP, this is known as Multiplier Effect.
The multiplier can be calculated using the following formula,
$$Multiplier(k)=\frac { Change\quad in\quad GDP }{ Increase\quad in\quad Components } $$
For the above Illustration, Multiplier can be calculated as
$$k=\frac { 2.44 }{ 1 } =2.44$$
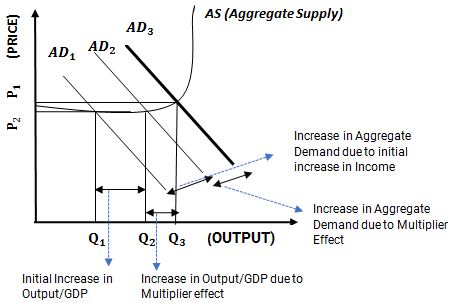 In the above diagram, AD1 is the initial level of Aggregate Demand, upon increasing one or more factors (C, X, I, G) an increase is expected in Aggregated Demand.
The Government invests Rs. 10, out of which public spends Rs. 8 which increases the Aggregated Demand to AD2 , however, when this Rs. 8 passes on as income to another sector of the population and they spend it and the cycle continues (explained above) the Aggregate Demand shifts to AD3 due to the multiplier effect. With the increase in Aggregate Demand, the GDP or the Output shifts initially to Q2, but due to the multiplier effect, it finally shifts to Q3.
If the MPS is small, then the difference between AD1 and AD3 is large (smaller MPS implies higher Multiplier) and if the MPS is large then the difference between AD1 and AD3 is small (larger MPS implies smaller Multiplier)
We have seen above that the components of Aggregate Demand have a circular impact on GDP, variation in any one of them affects the whole cycle. Like leakage in water, pipes lead to wastage of water, similarly, various leakages in the economy affect the Net Income or GDP. The leakages reduce the effect of the multiplier in the economy and the effect on GDP is less than what it should be, let us see all the leakages below:
- The value of k obtained above is not the actual multiplier, it’s just an illustration as we have considered only till step 3, however the cycle continues beyond step 3 in a similar manner until the income becomes zero.
- As seen in the above Illustration, the public has a habit of spending 80%, this is known as Marginal Propensity to Consume (MPC). The remaining 20% which is saved as referred to Marginal Propensity to Save (MPS).
- It is self-explanatory that a higher MPC will lead to a larger value of multiplier as the cycle will stretch for long and a higher MPS will have a lower multiplier, as the cycle will tend to terminate in few steps. In terms of MPS and MPC, the multiplier can be defined as.
$$Multiplier(k)=\frac { 1 }{ (1-MPC) } OR\frac { 1 }{ MPS } $$
Hence, for the above illustration, the actual multiplier is calculated as,
$$k=\frac { 1 }{ 1-0.8 } $$ $$=\frac { 1 }{ 0.2 } =5$$
Let us see Diagrammatic Representation of Above illustration:The Government invests Rs. 10, out of which public spends Rs. 8 which increases the Aggregated Demand to AD2 , however, when this Rs. 8 passes on as income to another sector of the population and they spend it and the cycle continues (explained above) the Aggregate Demand shifts to AD3 due to the multiplier effect. With the increase in Aggregate Demand, the GDP or the Output shifts initially to Q2, but due to the multiplier effect, it finally shifts to Q3.
If the MPS is small, then the difference between AD1 and AD3 is large (smaller MPS implies higher Multiplier) and if the MPS is large then the difference between AD1 and AD3 is small (larger MPS implies smaller Multiplier)
We have seen above that the components of Aggregate Demand have a circular impact on GDP, variation in any one of them affects the whole cycle. Like leakage in water, pipes lead to wastage of water, similarly, various leakages in the economy affect the Net Income or GDP. The leakages reduce the effect of the multiplier in the economy and the effect on GDP is less than what it should be, let us see all the leakages below:
- Saving: Savings is among the biggest leakage in the multiplier, with an increase in Savings the MPS increases, and that reduces the multiplier factor (k).
- Imports: The factor X of Aggregate Demand is the Net Exports which is obtained by Subtracting Imports from Exports (X= Export-Import), if the imports will increase, the value of X will reduce and that will ultimately have an impact on the GDP. If Exports rise by a certain percentage keeping imports constant) the multiplier effect will be much higher than the case where Exports rise with an increase in imports too.
- Tax: This is another big leakage in Multiplier after the Savings, taxes have an inverse effect on the Income of Population, with an increase in tax the net income of the population decreases and as a result the multiplier effect reduces. If Income rises by 10% without any rise in tax, the complete 10% will reach population, however, if there is an increase in tax, the net income that will reach population will be reduced.
- Inflation: if the rise in income is not followed by increased supply, it will lead to inflation in the market as people will have more money to spend but the same number of commodities to buy. The increased income will get nullified by increased inflation.
- Debt Cancellation: This refers to the situation where the increased income is used to pay loans/debts due to which it does not part a form of the expenditure and does not form a part of the multiplier cycle.
- Cash Balance: This refers to the situation where the public keeps the increased income idle i.e. do not spend it due to which it does not come into the multiplier cycle.
Accelerator
- While studying multipliers in the previous section we have understood that the individual factors of Aggregate Demand have a manifold impact on it, any change in any components leads to a multiplied change in the Aggregate Demand.
- When the Income of the public rises, their demand increases according to their level of spending (MPC), this increased demand creates an opportunity for industries to increase their production to meet the demand of the public.
- When the demand for a certain product increases in the market the industries increase their production to meet the demand and when the demand drops the industries reduce their production. To increase the production of a commodity in the market, companies need to invest in raw materials and machinery (capital goods). Hence, we can say that increase in demand leads to an increase in investment.
- Companies are investing to provide production capacity and so they will invest according to the growth rate of demand and not according to the actual level of demand. The company increases its investment with the rate of increase in demand. If the rate of increase in demand is low, the increase in investment is low and vice-versa. Hence, we may say that Investment depends on the rate of change of demand and not the actual demand, this concept is known as the Accelerator Theory.
- Accelerator Theory is an important term in Economics as it explains the following:
- The variation in production, demand, and investment on the same scales
- Explains how the industrial investment is driven by the rate of change of demand which is due to the change in income levels.
